BUG=skia:
NOTRY=true
DOCS_PREVIEW= https://skia.org/?cl=1414393010

Review URL: https://codereview.chromium.org/1414393010
3.2 KiB
Skia Debugger
Introduction
The Skia Debugger is a graphical tool used to step through and analyze the contents of the Skia picture format. Pre-requisites include installing the Qt Library and downloading the Skia code base.
Qt is available here: http://qt-project.org/downloads.
It can also be installed on linux using
sudo apt-get install libqt4-dev
Note that the debugger has been tested with Qt 4.8.6; it is known not to work with Qt 5.0RC1 on the Mac.
Design Documents:
https://docs.google.com/a/google.com/document/d/1b8muqVzfbJmYbno9nTv5721V2nlFMfnqXYLNHiSQ4ws/pub
How to build and run
Because the debugger uses Qt, you'll need to build skia in 64 bit mode:
cd trunk
./gyp_skia
GYP_DEFINES="skia_arch_width=64" make debugger
out/Debug/debugger
For Windows, Qt ships as 32 bit libraries so to build and run one should just be able to:
cd trunk
make clean gyp
<open solution in VS2010 and build everything>
Depending on how your Qt is installed you may also need to define an environment variable like:
GYP_DEFINES=qt_sdk='C:\Qt\4.8.6\'
(which needs to be set before you execute 'make gyp')
On Windows, you may need to copy several DLL and PDB files from %QTDIR%\bin into your executable directory (out/Debug or out/Release):
QtCore4.dll QtCored4.dll QtCored4.pdb
QtGui4.dll QtGuid4.dll QtGuid4.pdb
QtOpenGL4.dll QtOpenGLd4.dll QtOpenGLd4.pdb
Producing SKPs for usage
You may either use the Skia testing images (GMs) for use in the debugger or create your own via chromium.
To create SKPs from Chromium you must download and build chromium on your platform of choice: http://www.chromium.org/Home
cd src
make chrome
out/Debug/chrome --no-sandbox --enable-gpu-benchmarking --force-compositing-mode
After which go to Tools, Settings, Javascript Console and type:
chrome.gpuBenchmarking.printToSkPicture(dirname)
Using the Debugger
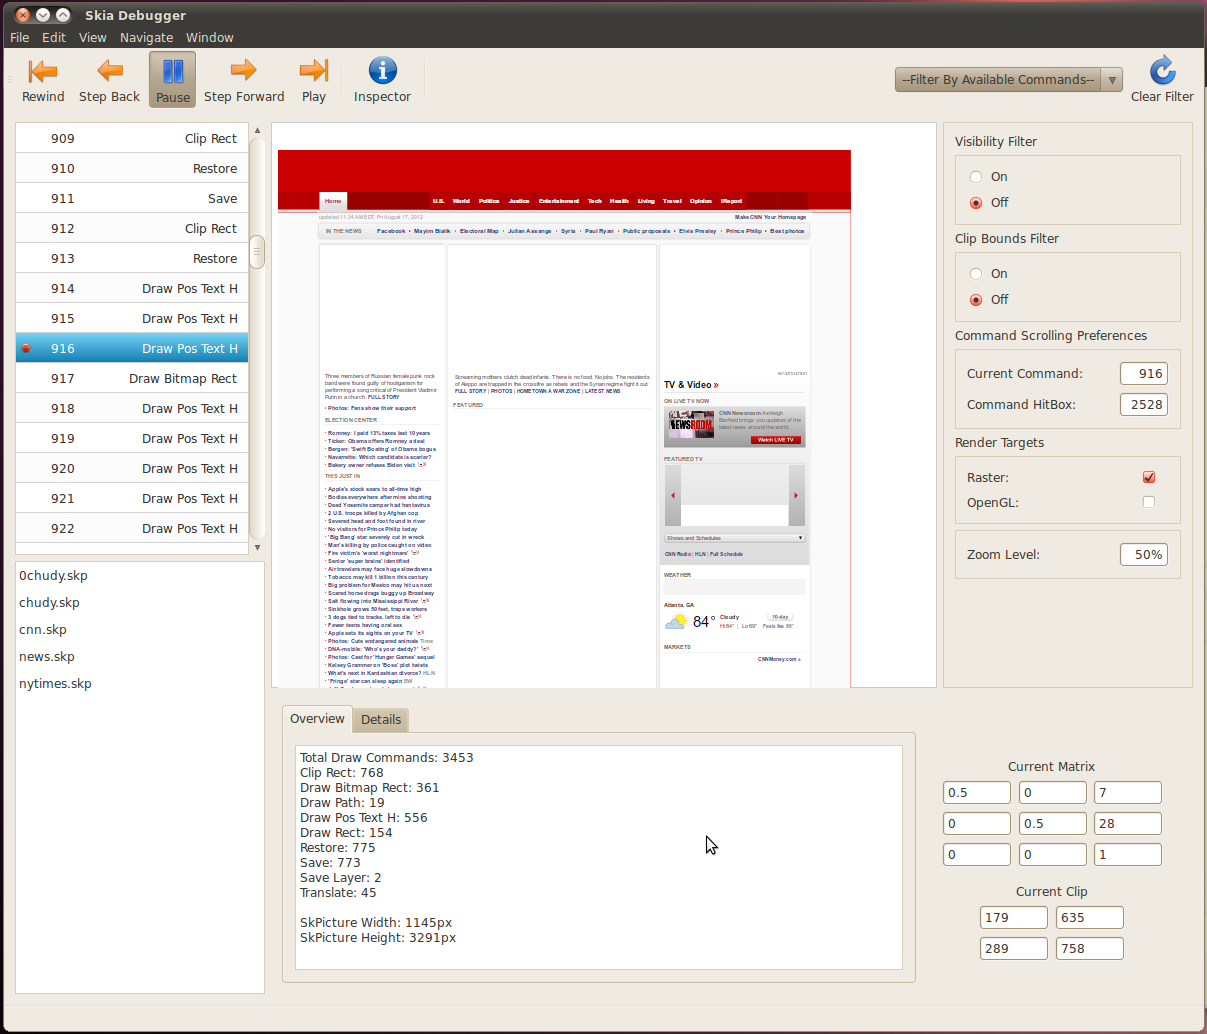
The debugger is fairly straight forward to use once a picture is loaded in. We can step through different commands via the up and down keys, and clicking on the command in the list. We can pause execution of commands with the pause button in order to inspect the details of the command in the inspector tabs down below.
| Command | Function |
|---|---|
| x | toggles the visibility of the selected command |
| alt-x | clears all hidden commands |
| ctrl-x | shows all deleted commands |
| b | creates a breakpoint on a command |
| alt-b | clears all breakpoints |
| ctrl-b | shows all breakpoints |
| ctrl-r | rewinds the picture to the first command |
| ctrl-p | plays to the next breakpoint or last command |
| ctrl-i | Toggles the inspector and settings widgets |
| ctrl-d | Toggles the directory widget |
| space | Pauses drawing execution |
| ctrl-o | Opens a file dialog for loading pictures |
| ctrl-s | Saves the skp if you deleted any commands |
| ctrl-shift-s | Saves the skp under the new specified name |
| ctrl-q | Quits |
