Also add new paragraph about using systrace correctly

Docs-Preview: https://skia.org/?cl=41502
Change-Id: I114c14cc2e87a8b72aec46d8c354d3ea877a41ab
Reviewed-on: https://skia-review.googlesource.com/41502
Reviewed-by: Mike Klein <mtklein@google.com>
Commit-Queue: Brian Osman <brianosman@google.com>
2.9 KiB
Tracing Skia Execution
Introduction
Skia is instrumented to provide execution traces in several ways. Within Chrome, Skia is traced with the standard tracing interface, along with the rest of Chromium. In the Android framework, Skia's tracing is integrated into atrace.
For standalone builds, Skia's tools (DM, nanobench, and Viewer) are capable of tracing execution
in three ways, controlled by the --trace command line argument.
Android ATrace
Running any tool with --trace atrace on an Android device will cause the application to forward
tracing information to atrace. On other
platforms, this has no effect.
If you run systrace from the host command line, you will need to supply -a <app_name>,
and the <app_name> argument will need to exactly match the command line used on the target
device. For example, if you use adb shell "cd /data/local/tmp; ./nanobench --trace atrace ..."
you must pass -a ./nanobench or systrace will ignore events from the application.
Console Logging
For simple situations, all tracing events can be directed to the console with --trace debugf:
# Run DM on a single GM with SkDebugf tracing
out/Release/dm --config gl --match ^gamma$ --trace debugf
[ 0] <skia.gpu> GrDrawingManager::internalFlush id=1 #0 {
[ 0] } GrDrawingManager::internalFlush
[ 0] <skia.gpu> GrGpu::createTexture id=1 #1 {
[ 0] } GrGpu::createTexture
[ 0] <skia.gpu> GrRenderTargetContext::discard id=1 #2 {
[ 0] } GrRenderTargetContext::discard
[ 0] <skia.gpu> SkGpuDevice::clearAll id=1 #3 {
[ 1]  <skia.gpu> GrRenderTargetContext::clear id=1 #4 {
[ 1]  } GrRenderTargetContext::clear
[ 0] } SkGpuDevice::clearAll
[ 0] <skia> SkCanvas::drawRect() #5 {
[ 1]  <skia.gpu> SkGpuDevice::drawRect id=1 #6 {
[ 2]   <skia.gpu> GrRenderTargetContext::drawRect id=1 #7 {
[ 3]    <skia.gpu> GrRenderTargetContext::addDrawOp id=1 #8 {
[ 3]    } GrRenderTargetContext::addDrawOp
[ 2]   } GrRenderTargetContext::drawRect
[ 1]  } SkGpuDevice::drawRect
[ 0] } SkCanvas::drawRect()
...
Chrome Tracing
Any other argument to --trace will be interpreted as a filename, and trace events will be written
to that file in JSON format, suitable for viewing with chrome://tracing.
# Run DM on several GMs to get tracing data
out/Release/dm --config gl --match bleed --trace gl_bleed_gms.json
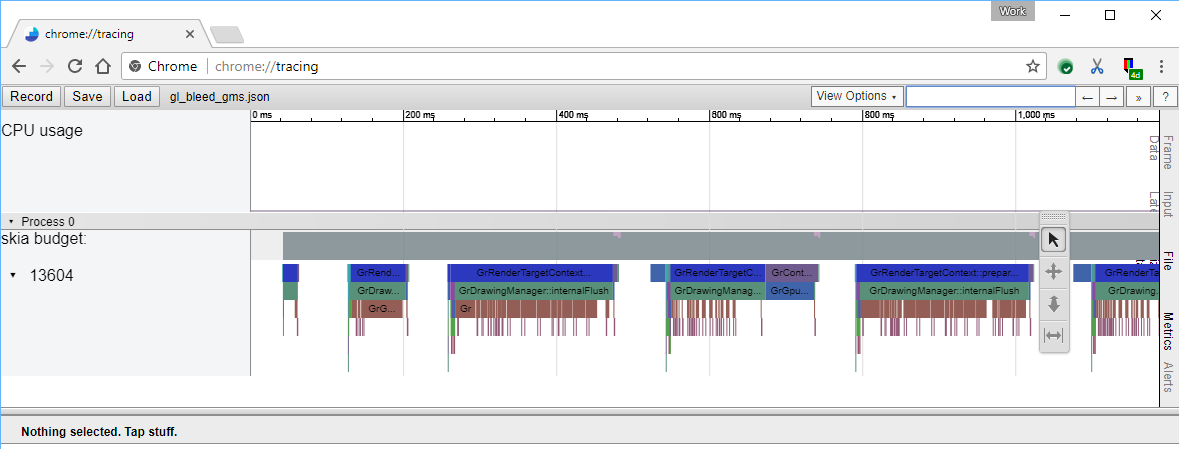
This creates a file gl_bleed_gms.json in the current directory. Go to
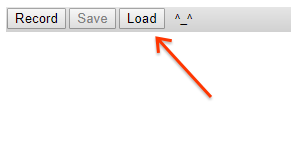
chrome://tracing, click Load:
... then select the JSON file. The data will be loaded and can be navigated/inspected using the tracing tools. Tip: press '?' for a help screen explaining the available keyboard and mouse controls.

